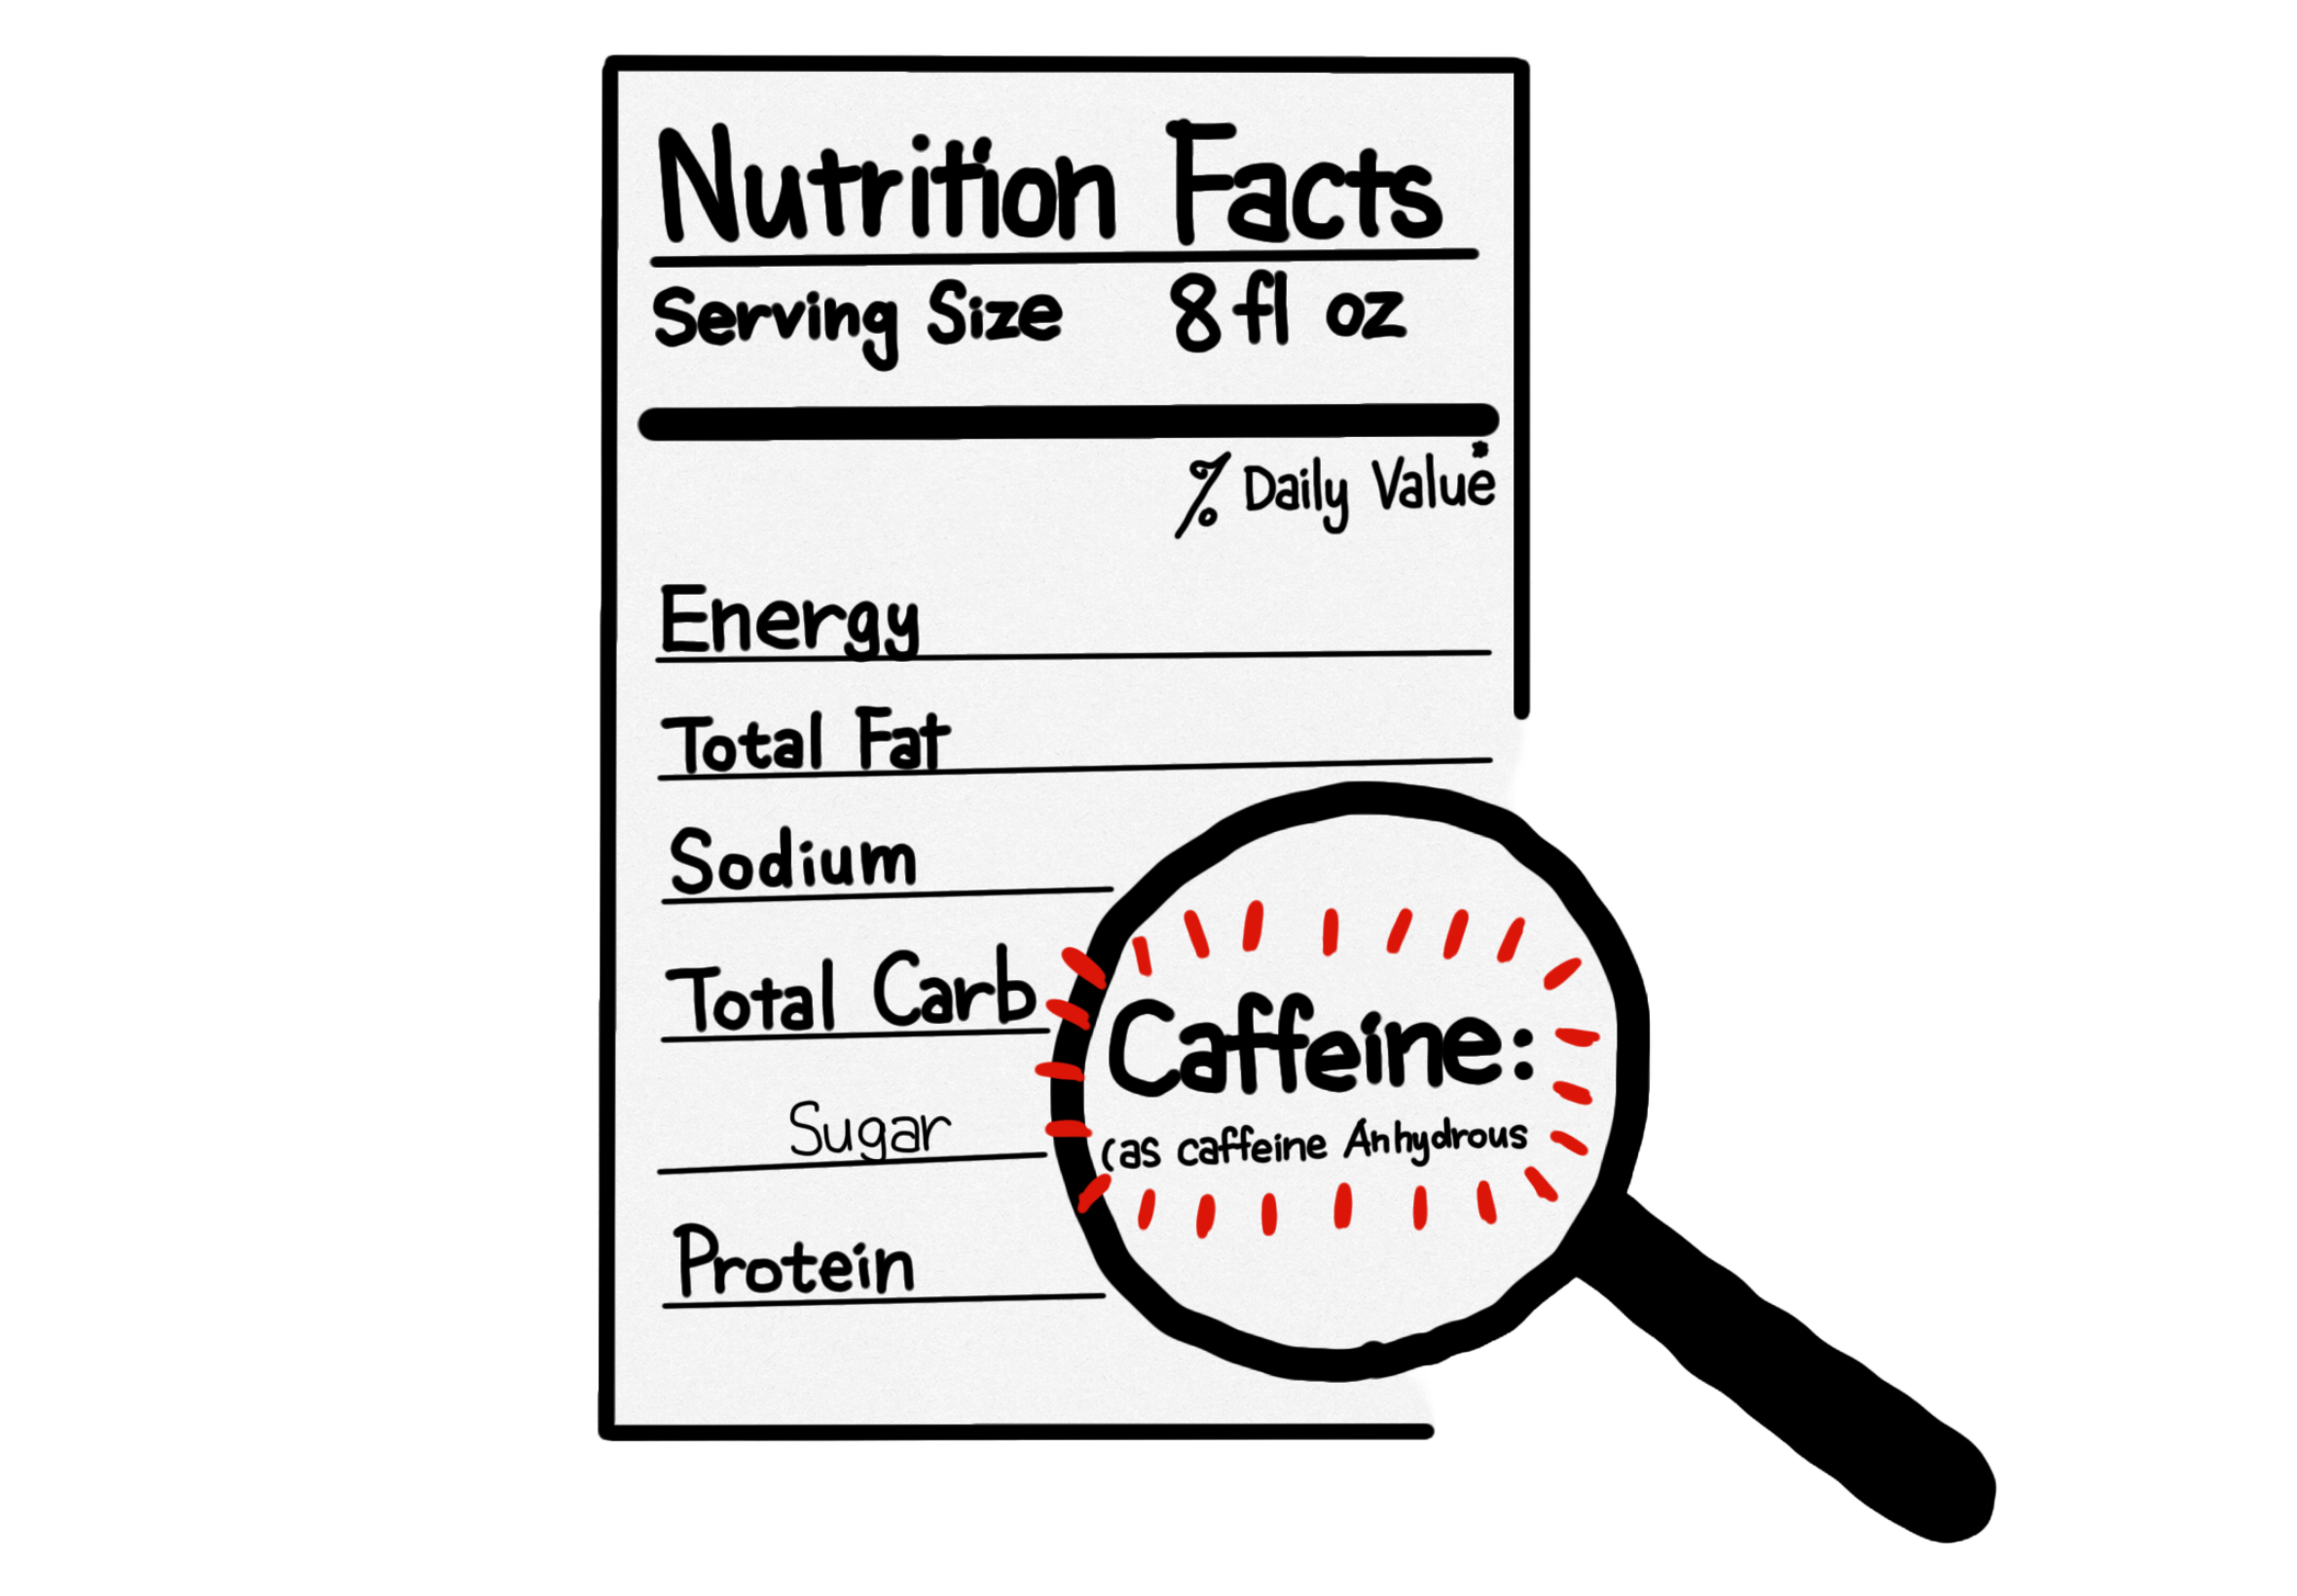
My exploration into America's unlabelled caffeine consumption began after noticing an alarming trend in
health-related incidents linked to unregulated caffeine intake. The case of Sarah Katz, who tragically passed
after consuming a highly caffeinated beverage from Panera Bread, was a starting point. Her story, shared widely in
the media, highlighted the broader issue of potential health risks from unlabelled caffeine in beverages that are
not typically associated with high caffeine content, such as lemonades and non-coffee drinks.
One of the key challenges in investigating this issue was the lack of comprehensive data on caffeine content in
various beverages. To understand the magnitude of this issue, I utilized several databases and conducted extensive
research to compile a list of common drinks and their caffeine content. The data was collected from various
sources,
including the USDA's FoodData Central, user-maintained databases, and major beverage manufacturers and cafe
chains.
- FoodData Central: This USDA portal provided a
comprehensive look at the ingredients in common
food items, particularly caffeinated drinks.
- Caffeine Informer: An updated user-maintained
database that lists caffeine content
for a variety of beverages available on the market.
- Major beverage manufacturers and cafe chains: I scraped their websites to gather information
on caffeine content and serving sizes.
Understanding the regulatory landscape was crucial. I reviewed the Food
Labeling Modernization Act of 2021 and
various international labeling standards, comparing them against U.S. practices. This comparison shed light on the
gaps in U.S. regulations concerning caffeine disclosure. Additionally, I studied two class-action lawsuits against
energy drink manufacturer, which highlighted the real-world consequences and
legal challenges associated with inadequate caffeine labeling on consumer products.
To provide an engaging and interactive reader experience, I incorporated several advanced visualization tools
within the story:
- D3.js: Utilized for creating dynamic and interactive data visualizations. This JavaScript
library helped me develop a custom caffeine tracker that allows readers to input their daily beverage
consumption and see how their caffeine intake compares to FDA recommendations. Additionally, D3.js was used to
craft an interactive graph showing various drinks and their caffeine content, enhancing the story's impact by
making data exploration intuitive and informative.
- Mapbox: Employed to develop an interactive global map showcasing different countries'
caffeine labeling laws. This feature enabled readers to click on various countries to view specific regulatory
details, effectively illustrating the global landscape of caffeine regulation. Mapbox's robust mapping
capabilities allowed for a visually appealing and easily navigable interface that enriched the story's global
perspective.
These tools were instrumental in bringing complex data sets to life, making them accessible and understandable to
a broad audience. By integrating these visual elements, the story not only conveyed the necessary information but
also engaged readers in an interactive learning process.
To gain a comprehensive understanding of the caffeine labeling landscape, I consulted a variety of sources,
including
public health advocates, doctors and legal experts. Here are the key sources of whom I would like to thank:
- Jonathan Kole Clinical Assistant Professor
of Psychiatry and Human Behavior, Brown University
- Eva Greenthal Senior Policy
Scientist, Center for Science in the Public Interest
- Edward W. Ciolko Attorney,
Sterlington PLLC
Their insights and expertise were invaluable in shaping the narrative and ensuring the accuracy and relevance of
the story's content. I am grateful for their contributions and guidance throughout the research process.

